The Amazing of Zig-zag Indicator
The zig-zag indicator is one of the default MT4 indicators that are easy to use. The zig-zag indicator is an indicator are repaint, meaning that these indicators are often moved around according to the latest price movements. For example, an emerging market movement (uptrend) then zig-zag indicator appears, then usually the indicator will continue to follow the movement of the price rises until it really has reached overbought. Similarly, when market prices were down (downtrend) then zig-zag indicator appears, then this indicator will continue to follow the movement of the price down until it is really already reached oversold. Therefore, a lot of traders who rarely use the zig-zag indicator, as they often get screwed with the movement of a repaint.
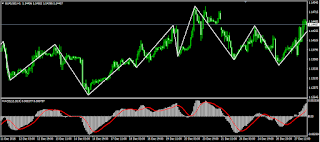
However, we need not worry, for zig-zag indicator will be very beneficial and helps you in forex trading if know how to use it. Because all indicators will be very useful if we already understand it. The following display indicator zigzag:
The zig-zag indicator consists of a straight line connecting the tops of the highest price and the lowest price in a certain period. The emergence of the highest and lowest prices thus can help us when determining the level of support and resistance. Basically, the zig-zag indicator appears when the price reaches a peak or a valley. However, its appearance may be a trap to us if we are less good at reading the direction of the trend of the market. Because the indicators will be used to follow the movement of the peaks or valleys. Therefore, in order for us not to be fooled with zig-zag movement then we can combine with other indicators, especially indicators oscillator lines. Why merge with indicator oscillator lines? Due to the nature of the oscillator lines indicator gives information to you, the price has reached overbought or oversold level.
We take one indicator MACD oscillator lines namely. The MACD indicator is an indicator of the oscillator lines no repaint so that we get the information market is bullish or bearish with MACD signal based. In fact, we can use other indicators, for example, stochastic, RSI, CCI, and others. However, all of them have the same way of working, i.e. as a confirmation to BUY or SELL. If zig-zag indicator combined with the MACD it will look like the following:
The timeframe that we use is free, permissible H1, H4, up to daily. However, we can take a medium time frame i.e. use TF H1.
Then, how do I use a combination of zig-zag with the MACD in trading forex?
Consider the following image:
The BUY Signal
- If zig-zag indicator appears when the movement of the market downtrend, wait until you reach the overbought.
- When the signal line (red line) crossing bar line (white bar) from the ground up, then it's time to open a BUY position.
- Do not open position if there has been no confirmation of that is the emergence of a crosswalk signal line and bar line.
- If zig-zag indicator appears when the movement of the market uptrend, wait until it reaches the oversold.
- When the signal line (red line) crossing bar line (white bar) from up to down, then it is time to open a SELL position.
- Do not open position if there has been no confirmation of that is the emergence of a crosswalk signal line and bar line.
Labels: MT4 Indicators


0 Comments:
Post a Comment
Subscribe to Post Comments [Atom]
<< Home