Sunday, December 30, 2018

Trade Easier with Envelopes

When we find a way than most trading easy and profitable. There are many ways to generate profit, but they are difficult and elaborate sets in use. One of the default MT4 indicators that are easy to use and profitable are the envelopes. The envelopes indicator is actually made up of two Moving Average with the period parameter 14. But both the MA not mutually aligned with each other, but both are running parallel in accordance with the direction of the market is going.

We can place the envelopes indicator on MT4 with steps as follows:
1. Select the icon "List of indicators" and then select the type of indicator "Trend" then it would appear many options. Select "Envelopes"
2. a dialog Appears that shows the default parameters indicator Envelopes, i.e. from 14.
3. then click "OK" then the Envelopes indicator will appear as follows:

Parts of the Envelopes indicator:
The envelopes indicator consists of two Moving averages that are blue and red.
Blue line
  • Blue line means a bullish signal pointer. 
  • The blue line is also a dynamic resistance level, meaning the resistance moves always follow the direction of the market price.
  • The blue line as well as a place to put up a stop loss (SL) at any open positions sell.
Red Line
  • The red line as signal a bearish hint. 
  • The red line is also a dynamic support level following the direction as to where the market price moves.
  • The red line as well as a place to put up a stop loss (SL) at each position buy.
Space Consolidation (Sideways)
  • While the spaces in between the blue and red lines are consolidated. 
  • When prices are in a consolidation in the space (between the blue and red lines) then we don't enter the market. 
  • We wait until the price out of space consolidation that. 
  • If the price out of the blue line means going breakout and prices will rise (bullish).
  • If prices get out of the line of Red means going breakout down and prices will go down (bearish). 
But, keep in mind that the movement is not as smooth as we imagine. Usually the case price movements up and down in such a way that it can make us get screwed. Therefore, it should be a concern is the blue and red lines.

Then, how do I open the correct position by using the Envelopes indicator?
See the following image:
Enter BUY
  • We recommend that you enter into the market when the London session open.
  • Wait until the rate reaches the blue line.
  • If the price is already past the blue line then appears bullish candle so that the price exceeds the price before then means the market is bullish. Soon we open BUY position.
  • Install the stop loss (SL) on the red line.
Enter SELL
  • We recommend that you enter into the market when the London session open.
  • Wait until the price has reached the red line.
  • If the price is already past the red line then appeared bearish candle so the price is lower than previous rates will mean the market is bearish. We SELL open positions immediately.
  • Install the stop loss (SL) on the blue line.
Pending Order
Pending orders are performed by placing two pending orders at once i.e. the Buy Stop and Sell Stop

Buy Stop
  • Before the London session open, install a buy stop above the blue line (about 40 pips)
  • Install the TP around 500 pips
  • Install the stop loss (SL) on the red line.
Sell Stop
  • Before the London session open, install a sell stop below the red line (about 40 pips)
  • Install the TP around 500 pips
  • Install the stop loss (SL) on the blue line.
If one of the pending order is touched then close one of the pending orders are not touched.
Do pending orders before London open session or before there is important news release.

Labels:

Trading is easy with MFI

MFI (Money Flow Index) actually is one of the indicators of the volume provided by MT4 to complement the trading tools in there. Although these indicators including indicators of volume but its use are more based on the workings of the oscillator lines indicator. This indicator includes two lines as the overbought level (level 80) and oversold level (level 20), but we can add one more level, i.e. the level 50 (middle line) as a reference to see the forwarding or reversal of the price. 

We can display this indicator MFI for tool detection direction of the trend, with the following steps:
1. Select the icon in the form of the green plus sign next to the top of MT4. Then choose "Volumes" then select the "Money Flow Index"
2. then select "levels" tab to add a level of the middle line. Press the button "Add" and then write the number 50 on the column level. Then click "Ok". 
3. Then level 50 as the middle line will be attached to the chart.
Things that should be noticed in using indicators MFI are:
  • The level above the middle line (above level 50) is the bullish area
  • A level in under middle line (below level 50) is the bearish area
  • Although the level 80 upwards as the overbought area, but a reversal of the price does not have to be in the area.
  • Although the level 20 down as oversold area, but a reversal of the price does not have to be in the area.
  • Confirm YOUR BUY or SELL during the crossing of the line exceeds the level curves of the MFI.
How do I use the indicator MFI for determining the open BUY or SELL?

OPEN BUY
  • If the price movement (curve) is in the area then crossed the line more oversold level 20, or line level 50 (middle line) from bottom to top.
  • See the candle patterns are formed after the price of the pass level 20 or 50 heading upwards. If the candle is bullish candle formed then we are ready to open a BUY position.
OPEN SELL
  • If the price movement (curve) is in overbought area then crossed more lines of level 20, or line level 50 (middle line) from top to bottom.
  • See the candle patterns are formed after the price level in line 80 or 50 heading down. If the candle is bearish candle formed then we are ready to open a SELL position.
Note:
  • In order for us not to be fooled by the price movement then note the price level when passing through the 20, 50 and 80. 
  • After crossing the price to the level of the lines see the pattern of a candle that is formed as a confirmation.


Labels:

Detect Price Reversals with Bollinger Bands

Bollinger Bands are one of the main indicators used by professional traders. Because Bollinger Bands indicators have different characteristics with other indicators. In fact, if we have understood the characteristics of Bollinger Bands then surely want to always use these indicators in forex trading. Privileges possessed by the Bollinger Bands is if the condition of the market is sideways so the upper bands (upper bands) and lower bands (bands section below) will be flat. If the market is going higher volatility then the upper and lower bands will open wide. I think such conditions already provide sufficient information for us to read the movement of the market. Look at market conditions described by Bollinger Bands:
In simple terms, it can be said that:
  • The market will be bullish if the upper and lower bands wide open, while the price is above the middle bands. 
  • The condition of the market is bearish if the upper and lower bands wide open, while prices were below middle bands.
So, how to use Bollinger Bands indicator is very simple and not complicated. Because of our attention only on the price movement of above or below the middle bands. But, this time we will discuss the price reversal using Bollinger Bands indicator. 

Then, how do I read a reversal of market prices by using Bollinger Bands indicator?

Look at the image below:
Buy or Sell Confirm
Reversal from BEARISH to BULLISH
  • Note If the trend is bearish (downtrend) then there is a bullish candle close above the lower bands.
  • Wait do not enter the market, to appear more bullish candle cover exceeds the previous candle high (higher than the previous candle). 
  • If the candle close exceeded the previous candle then means to confirm the price will either be a bullish direction, then we take BUY position.
Reversal from BULLISH to BEARISH
  • Note If the trend is being bullish (uptrend) then there is a bearish candle closes below the upper bands.
  • Wait do not enter the market, to appear more bearish candle cover exceeds the previous candle Valley (lower than the previous candle). 
  • If the candle closes lower than the previous candle then means to confirm the price will either be a bearish direction, then we take the SELL position.

Reverse the direction of the market conditions that usually if the price has reached the level of overbought as well as oversold.

Labels:

The Amazing of Zig-zag Indicator

The zig-zag indicator is one of the default MT4 indicators that are easy to use. The zig-zag indicator is an indicator are repaint, meaning that these indicators are often moved around according to the latest price movements. For example, an emerging market movement (uptrend) then zig-zag indicator appears, then usually the indicator will continue to follow the movement of the price rises until it really has reached overbought. Similarly, when market prices were down (downtrend) then zig-zag indicator appears, then this indicator will continue to follow the movement of the price down until it is really already reached oversold. Therefore, a lot of traders who rarely use the zig-zag indicator, as they often get screwed with the movement of a repaint. 

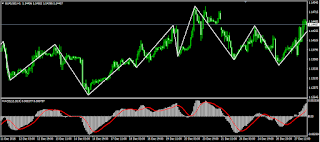
However, we need not worry, for zig-zag indicator will be very beneficial and helps you in forex trading if know how to use it.  Because all indicators will be very useful if we already understand it. The following display indicator zigzag:
The zig-zag indicator consists of a straight line connecting the tops of the highest price and the lowest price in a certain period. The emergence of the highest and lowest prices thus can help us when determining the level of support and resistance. Basically, the zig-zag indicator appears when the price reaches a peak or a valley. However, its appearance may be a trap to us if we are less good at reading the direction of the trend of the market. Because the indicators will be used to follow the movement of the peaks or valleys. Therefore, in order for us not to be fooled with zig-zag movement then we can combine with other indicators, especially indicators oscillator lines. Why merge with indicator oscillator lines? Due to the nature of the oscillator lines indicator gives information to you, the price has reached overbought or oversold level. 

We take one indicator MACD oscillator lines namely. The MACD indicator is an indicator of the oscillator lines no repaint so that we get the information market is bullish or bearish with MACD signal based. In fact, we can use other indicators, for example, stochastic, RSI, CCI, and others. However, all of them have the same way of working, i.e. as a confirmation to BUY or SELL. If zig-zag indicator combined with the MACD it will look like the following:
The timeframe that we use is free, permissible H1, H4, up to daily. However, we can take a medium time frame i.e. use TF H1. 

Then, how do I use a combination of zig-zag with the MACD in trading forex?

Consider the following image:
The BUY Signal
  • If zig-zag indicator appears when the movement of the market downtrend, wait until you reach the overbought.
  • When the signal line (red line) crossing bar line (white bar) from the ground up, then it's time to open a BUY position.
  • Do not open position if there has been no confirmation of that is the emergence of a crosswalk signal line and bar line.
The SELL Signal
  • If zig-zag indicator appears when the movement of the market uptrend, wait until it reaches the oversold.
  • When the signal line (red line) crossing bar line (white bar) from up to down, then it is time to open a SELL position.
  • Do not open position if there has been no confirmation of that is the emergence of a crosswalk signal line and bar line.
So, how to use the zig-zag indicator in forex trading. We can combine with the other indicators. The important thing is we can understand and use indicators as well so that the benefit.

Labels:

The ADX Indicator

One of the indicators in MT4 is the ADX (Average Directional Movement Index). This indicator is in fact already very powerful use for trading forex. ADX is used to see the strength of the trend is going. Because basically the movement trend market that there are three, uptrend, downtrend, and sideways (range). Actually, that's the key to trading forex i.e. know the trend is going on in the market. We do the actual forex trading activity following the direction of the trend. If we can follow the direction of the trend correctly then we will benefit. If our order is not in line with the direction of the trend and in the end we will see a loss.

MT4 already provides many default indicators are practical and easy to use for forex trading. But many traders do not know the usefulness of each indicator that. If we already know and understand about the indicator ADX for sure we are not going to use other indicators. Following is the display of the ADX indicator by default on MT4:

Parts of the ADX indicator is the ADX line, + D  line, and - D line. ADX line function to find out the strength of the trend. If the ADX line is rising means the strength of the burgeoning trend. If the ADX line was further down then the power trend was further weakened. While the + D line as a sign of uptrend line, means if + D line is above the – D line then movements of the market are the uptrend. While the – D line as a sign of the downtrend line. If the – D line is above + D line then movements of the market are a significant downtrend.

How to install this indicator are as follows:
1. Select the icon "Indicators list" (green plus sign) on the icon bar at the top of MT4
2. A dialog box appears, select the "Trend" then select the "Average Directional Movement Index"

3. Indicators appear by default on the chart the ADX

4. We can change the color and lines as you wish. Do I right click on the chart, appears "Indicators List".

5. Indicator ADX will appear. Then click the "Edit" button it will pop up a dialog box,

6. And select "Colors". There we can change the color of  + D line and  – D line as you wish.

7. In our example, we change the color + D line with green color, and change – D line in red. We also change the line thickness to be easy.

8. If you are confident with the change and then click the OK button, then the display indicator ADX will appear like this:

Then, how do I use the ADX indicator with trading?

The most important thing to note is the direction of the ADX line. If ADX line increasing up then it is the harbinger of a trend is being strengthened. If ADX line was further down then it is the harbinger of a trend is being weakened. If ADX line averages mean the market is sideways.
We go to the market when the ADX is being increased because that's when the trend is strong.

Note the picture below:
Buy - Sell with The ADX Indicator
Enter BUY
If the + D line (green) crosses the – D line from bottom to the top while the ADX line goes up, the more means a strong bullish trend, then we get BUY.

Enter SELL
If the - D line (red) crosses the + D line from bottom to the top while the ADX line goes up, the more means a strong bullish trend, then we enter a SELL.

So, how to use a powerful indicator ADX for forex trading. We should test in trading a demo account until we really mastered the use of these indicators.

Labels: